For the last several decades, the stock market has consistently scared and rewarded investors.
The normally quiet summer months of 2015 have been quite eventful on Wall Street; major stock indexes in the U.S. and abroad have experienced big movements in both directions.
Such volatility is nothing new. Historically, the stock market has whipped back and forth around its long-term trend — sometimes quite dramatically. While it is human nature to focus on the magnitude of the ups and downs, the long-term trend is of course the more important metric.
Improving Odds
Since 1950, the S&P 500 has had more than 7,600 losing sessions during which it has shed nearly 29,000 points. The number of winning sessions — about 8,700 — is slightly higher, as is the aggregate gain on these days (about 31,000 points).
Those are not very good odds; there is a nearly 50 percent chance that the market will be down on any given day. But when that coin is flipped enough times, the likelihood of positive returns increases steadily.
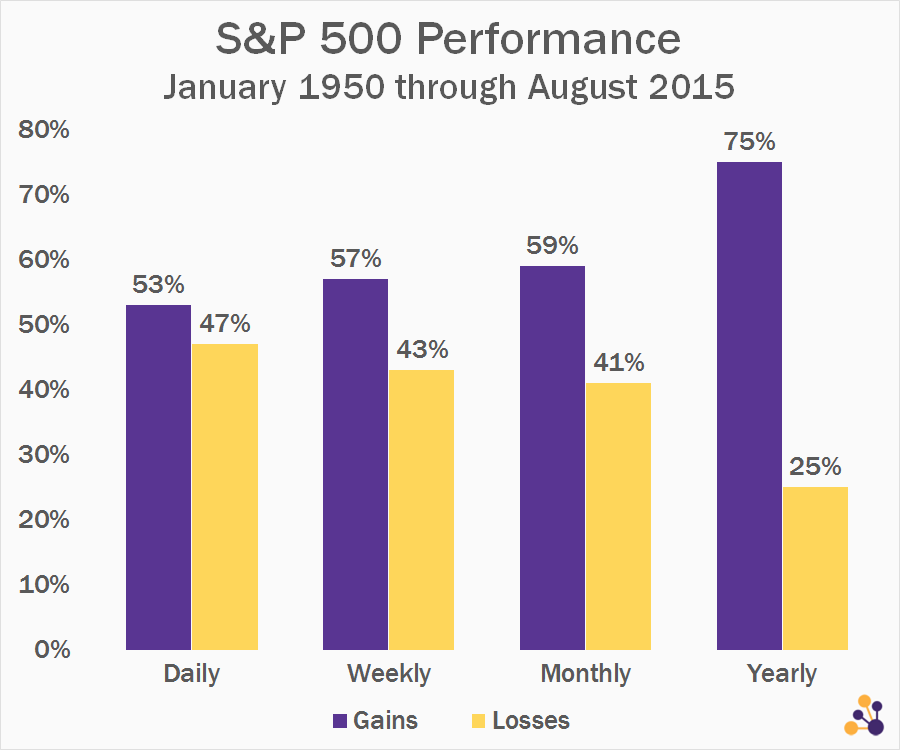
Still, roughly two out of every five months and one in every four years will see stocks decline. Most investors will experience thousands of losing sessions, hundreds of losing months, and about a dozen or so losing years for stocks. And, at the end of it all, the odds are that they’ll come out way ahead.
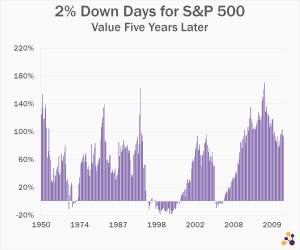
Big Losses, Five Years Later
Major down days for stocks always seem like a brand new crisis. But there is nothing new about the S&P 500 dropping 2 percent in a single session. It has happened hundreds of times — more than 350 since 1950 to be exact — and occurs at least once in most years.
The chart below represents each day since 1950 that the S&P 500 has lost 2 percent or more. The values shown indicate the change in the index value five years after the big dip.

Historically, the five-year period following a 2 percent down day for the S&P 500 has experienced positive performance 95 percent of the time. (Note that there is significant overlap among some of these data points.)
Long-Term Trends
In January 1950, the S&P 500 index stood at about 17. By September 2015, it had grown to approximately 1,970. That represents an average daily growth rate of about 0.027 percent — which corresponds to about half a point on the current value of the index.
The average absolute daily change over that 65-year period has been about 0.66 percent — or roughly 24 times the compound rate. In other words, on an average day the stock market is about 24 times more volatile than its long-term trend.
Predicting exactly what the future holds for the global economy and global markets is little more than entertainment. But it is possible to make some general educated guesses. One of those is this: stock markets will continue to bounce back and forth — often dramatically — across a long-term upward trend line.
About the Author: Michael Johnston
Michael Johnston is senior analyst for ETF Reference, and also serves as COO of parent company Poseidon Financial. His investment expertise has been featured in The Wall Street Journal, Barron’s, and USA Today, among other publications. He resides in Chicago.
Comments