
Would endowments be better off with a simple, low-cost ETF portfolio?
By most metrics, this is a golden age for college endowments. Balances have soared thanks to an extended stock market rally. More than 40 institutions now have endowments of $2 billion or more. Seven have more than $10 billion, led by Harvard’s $36 billion.
But there is another way to view the state of college endowments in 2015; institutions are leaving more money on the table than ever before. Many universities maintain large investment teams dedicated to preserving and growing the school’s endowment. The strategies employed are typically much more complex than the average individual investor; internal and external experts specialize in managing derivatives, private equity holdings, and even real assets such as farmland.
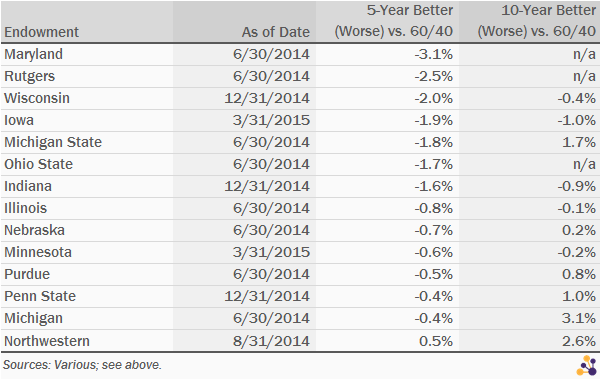
Despite the significant budgets and expert guidance, most endowments have failed to match one of the simplest investment strategies available. A portfolio composed of a 60 percent allocation to the S&P 500 SPDR (SPY) and 40 percent allocation to the Barclays Aggregate U.S. Bond Fund (AGG) would have outperformed almost every Big Ten university endowment over the past five years, and beaten about half of them over the last decade.
The schools are presented in order of relative performance compared to the 60 / 40 portfolio described above over the last five years, from worst to best.
Maryland
Maryland has one of the smaller endowments in the Big Ten Conference, and is also one of the worst performers over the past five years. The general fund has lagged the SPY-and-AGG portfolio by more than 300 basis points annually.
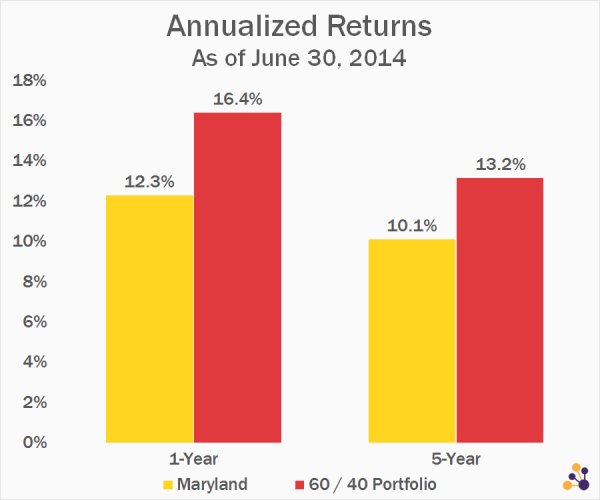
Data Source: University of Maryland. 60 / 40 Portfolio = 60% SPY and 40% AGG, rebalanced annually.
Rutgers
The other recent entrant to the Big Ten brings up the rear for this custom performance metric. For the five years ended June 2014, Rutgers trailed the simple two-ETF portfolio by about 250 basis points annually.
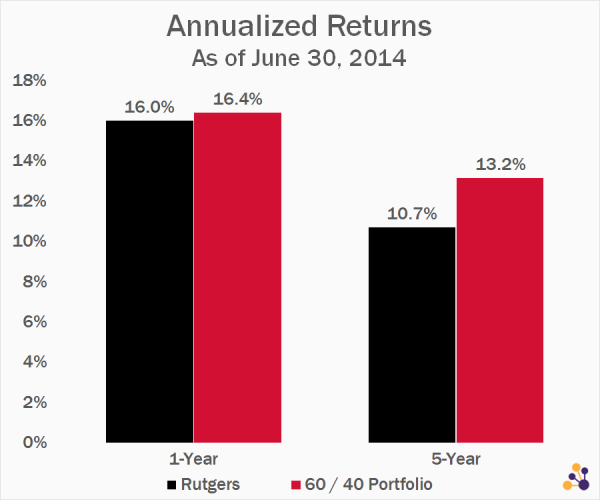
Data Source: Rutgers. 60 / 40 Portfolio = 60% SPY and 40% AGG, rebalanced annually.
Wisconsin
Wisconsin’s endowment is trailing the SPY-and-AGG portfolio over just about every time period, including the one-year (about 450 basis points) and 10-year (40 basis points annually).
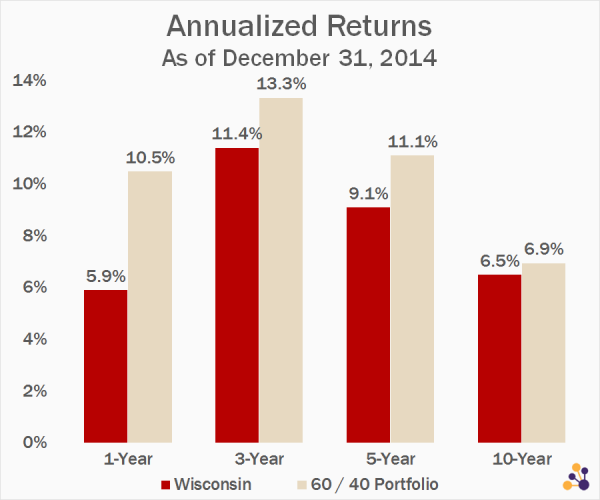
Data Source: University of Wisconsin. 60 / 40 Portfolio = 60% SPY and 40% AGG, rebalanced annually.
Iowa
Like Wisconsin, the University of Iowa would also have been much better off embracing a two-ETF portfolio 10 years ago. The endowment has trailed that custom benchmark by about 100 basis points annually.
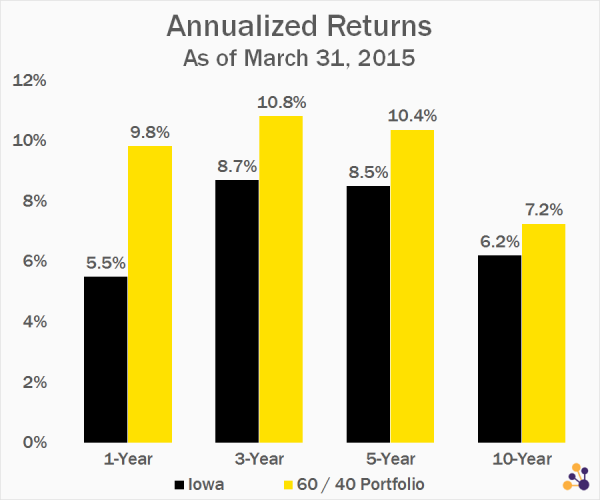
Data Source: University of Iowa. 60 / 40 Portfolio = 60% SPY and 40% AGG, rebalanced annually.
Michigan State
Over the past decade, Michigan State’s endowment has performed quite well. But it still has trailed the SPY-and-AGG portfolio over a more recent time frame.
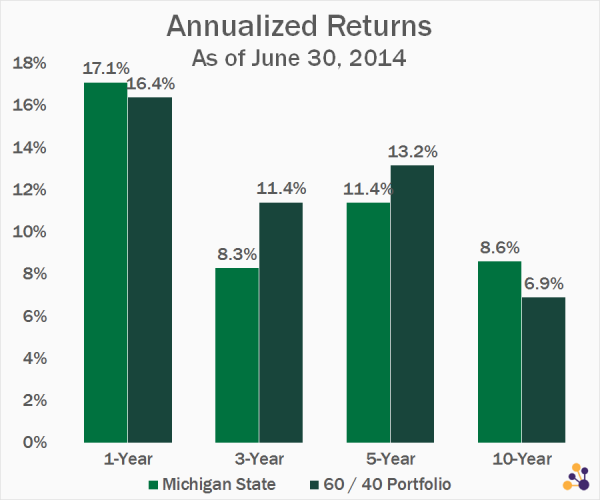
Data Source: Michigan State. 60 / 40 Portfolio = 60% SPY and 40% AGG, rebalanced annually.
Ohio State
The Ohio State University is one of the largest higher education institutions in the country. Its endowment has recovered nicely from the recent recession, but it would have done much better with a simple 60/40 strategy.
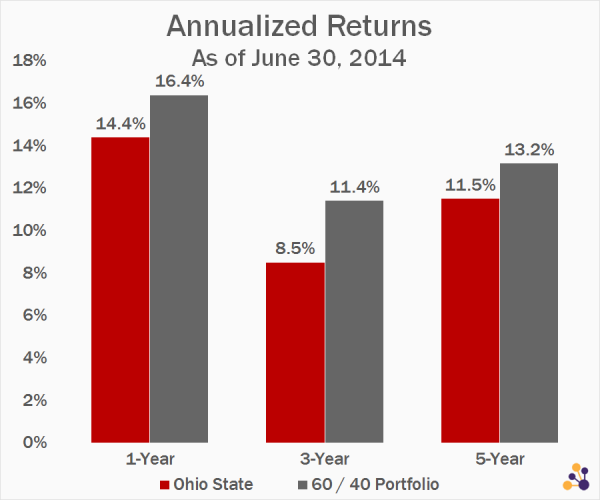
Data Source: Ohio State. 60 / 40 Portfolio = 60% SPY and 40% AGG, rebalanced annually.
Indiana
Indiana University is another endowment that has endured a challenging decade; it has fallen about 90 basis points short of the SPY-and-AGG portfolio on an annual basis.
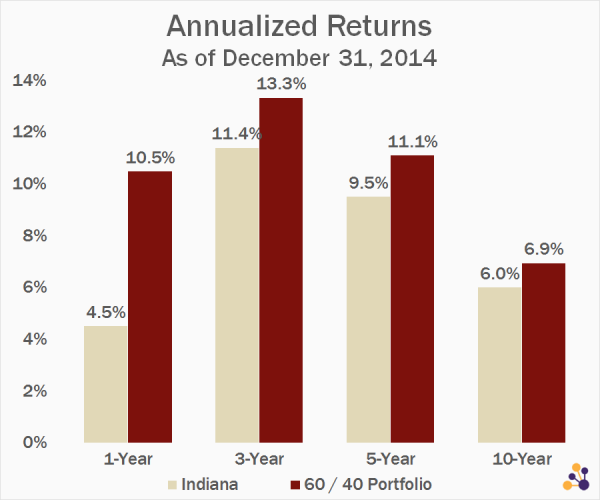
Data Source: Indiana University. 60 / 40 Portfolio = 60% SPY and 40% AGG, rebalanced annually.
Illinois
Illinois is perhaps the most fiscally irresponsible state in the union, so it is perhaps no surprise that the University of Illinois endowment fund has lagged behind the most basic portfolio — over the last decade.
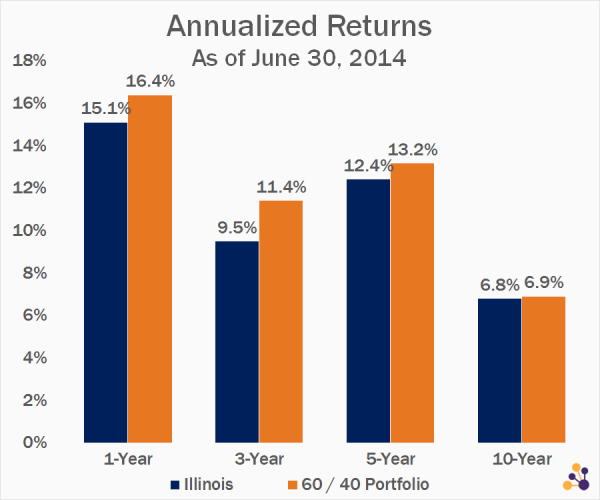
Data Source: University of Illinois. 60 / 40 Portfolio = 60% SPY and 40% AGG, rebalanced annually.
Nebraska
Nebraska’s endowment is in positive territory over the last decade, but it has lagged during the recent five-year bull market.
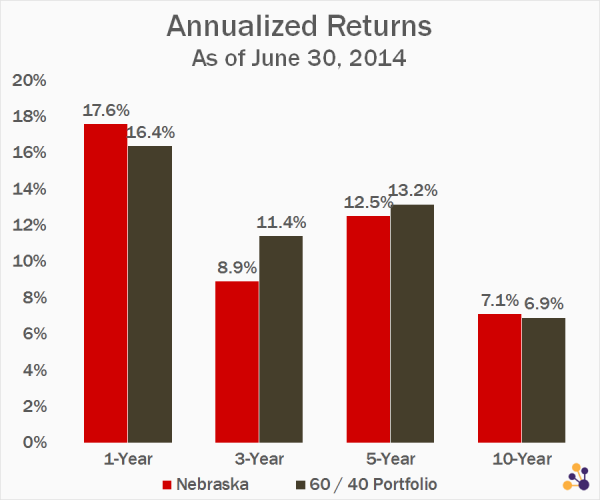
Data Source: University of Nebraska. 60 / 40 Portfolio = 60% SPY and 40% AGG, rebalanced annually.
Minnesota
The University of Minnesota endowment has also fallen short over both five- and 10-year stretches.
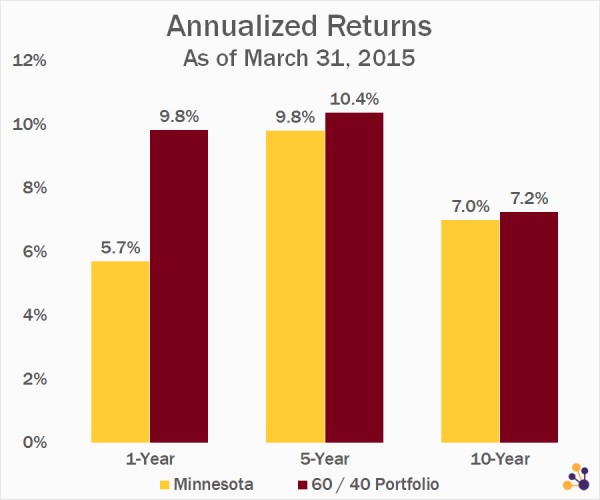
Data Source: University of Minnesota. 60 / 40 Portfolio = 60% SPY and 40% AGG, rebalanced annually.
Purdue
Purdue’s endowment has done quite well over the past decade, returning 7.7 percent annually. But during the most recent five-year stretch, the fund would have been better off with a much simpler strategy.
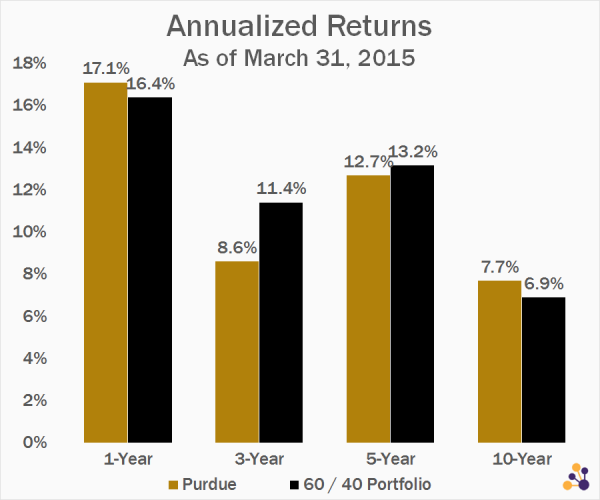
Data Source: Purdue University. 60 / 40 Portfolio = 60% SPY and 40% AGG, rebalanced annually.
Penn State
Despite relatively weak performances over the last five years, Penn State’s endowment has done quite well over a longer time horizon.
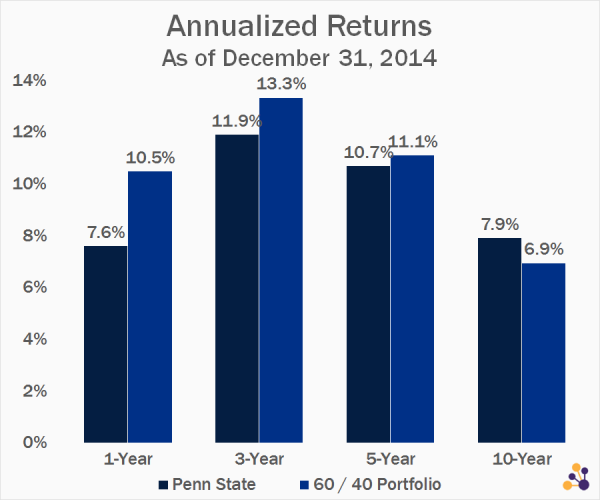
Data Source: Penn State. 60 / 40 Portfolio = 60% SPY and 40% AGG, rebalanced annually.
Michigan
Michigan’s endowment is one of the best performers over the past decade, delivering an even 10 percent annual gain.
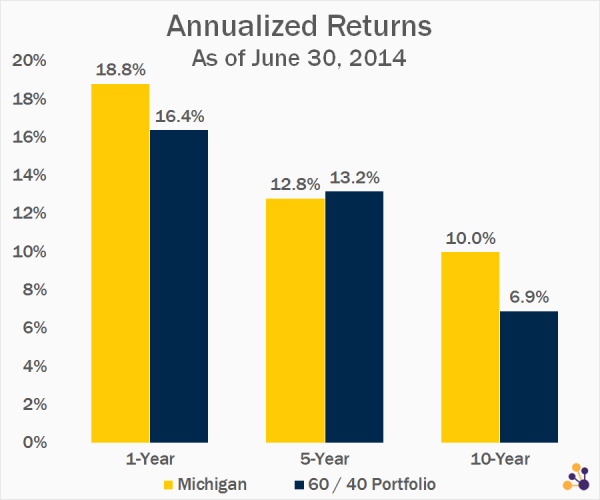
Data Source: University of Michigan. 60 / 40 Portfolio = 60% SPY and 40% AGG, rebalanced annually.
Northwestern
Northwestern is the only Big Ten school whose endowment fund has managed to beat a simplified benchmark over the last five years. The fund has also done quite well over a longer 10-year period, beating the two-ETF SPY-and-AGG benchmark by about 260 basis points annually.
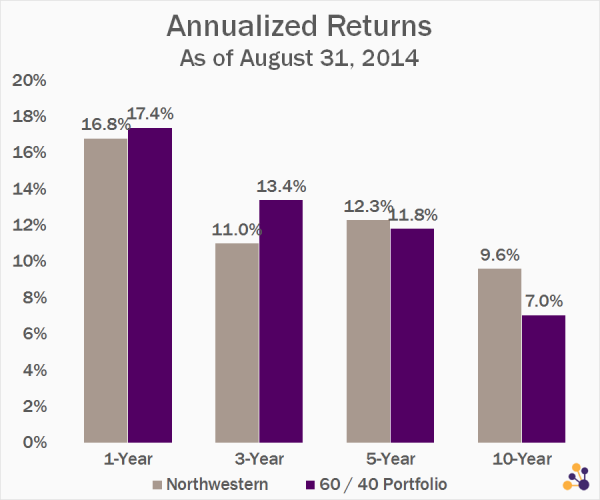
Data Source: Northwestern. 60 / 40 Portfolio = 60% SPY and 40% AGG, rebalanced annually.
Time to Simplify
The above hardly constitutes a scientific examination of endowment fund returns; beyond the limited number of examples, there was no discussion of the specific investment objectives and risk targets. Many endowments maintain relatively low risk tolerances that would make the simplified SPY-and-AGG portfolio inappropriate. Moreover, several of the endowments highlighted have beaten the custom benchmark over a 10-year period that includes a severe bear market. (Six of the 11 for which data was available have outperformed the SPY-and-AGG model over the last decade.)
The fact remains, however, that many college endowments would have more assets — in some cases hundreds of millions of dollars more — if they’d favored the simple and cost-efficient over the sophisticated and expensive. This is worth repeating:
Most Big Ten endowments would be better off if, five years ago, they had fired their entire investment teams and invested in a simple two-ETF portfolio.
Many of them would be better off if they had embraced Boglehead principles a decade ago.
Some endowments do manage to generate positive ROI from their investment teams, growing assets while complying with the unique requirements of the endowment structure. But most would be better off handing the controls to a robot, tracking the market, and minimizing fees.
About the Author: Michael Johnston
Michael Johnston is senior analyst for ETF Reference, and also serves as COO of parent company Poseidon Financial. His investment expertise has been featured in The Wall Street Journal, Barron’s, and USA Today, among other publications. He resides in Chicago.

Comments