VWO

10 Strange But True Facts About Popular ETFs

The Clown
Published on . Posted in News and tagged , , , , , , , , , , , , , , , , , , , , , , , , ,

The idea of creating a stock index may seem relatively straightforward: come up with a few rules, set a few filters, and crank out the basket of stocks that matches a particular investment thesis. In reality, it isn't always that simple. As companies expand their businesses into new countries and industries, achieving pure play exposure can become a bit tricky.  Continue reading →
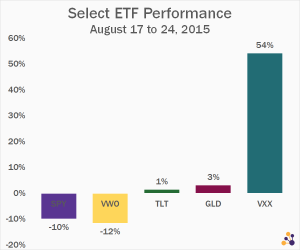
Why the VIX ETF Is a Terrible Investment, in 3 Charts

VXX Crisis Performance
Published on . Posted in News and tagged , , , ,

As the ETF universe has expanded beyond basic stocks and bonds, volatility is one of the asset classes that has opened up. But just because a strategy can be packaged into the exchange-traded wrapper does not mean it is appropriate for long-term investors. Volatility ETFs -- with more than $1 billion in total assets -- can be extremely useful for certain types of traders in certain situations. But for true investors, these products have nothing to offer.  Continue reading →

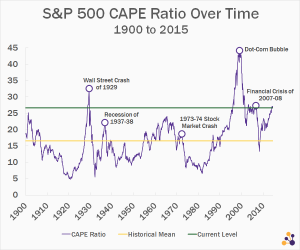
Why the Stock Market May Be Overvalued, in 10 Charts

S&P 500 CAPE Ratio Over Time (1900-2015)
Published on . Posted in News and tagged , , , ,

Since 2013, the Dow Jones Industrial Average has closed at a record high 95 times -- most recently on May 18, 2015. While it's impossible to predict the future, and while no single metric is without flaws, several fundamental valuation ratios indicate that the U.S. stock market is currently trading at a premium compared to its own history, compared to other countries and regions, and when considering future return projections. Below are 10 charts that make use of these valuation ratios and return projections to illustrate this point. Continue reading →